Unlock really, really, really
robust data mining.
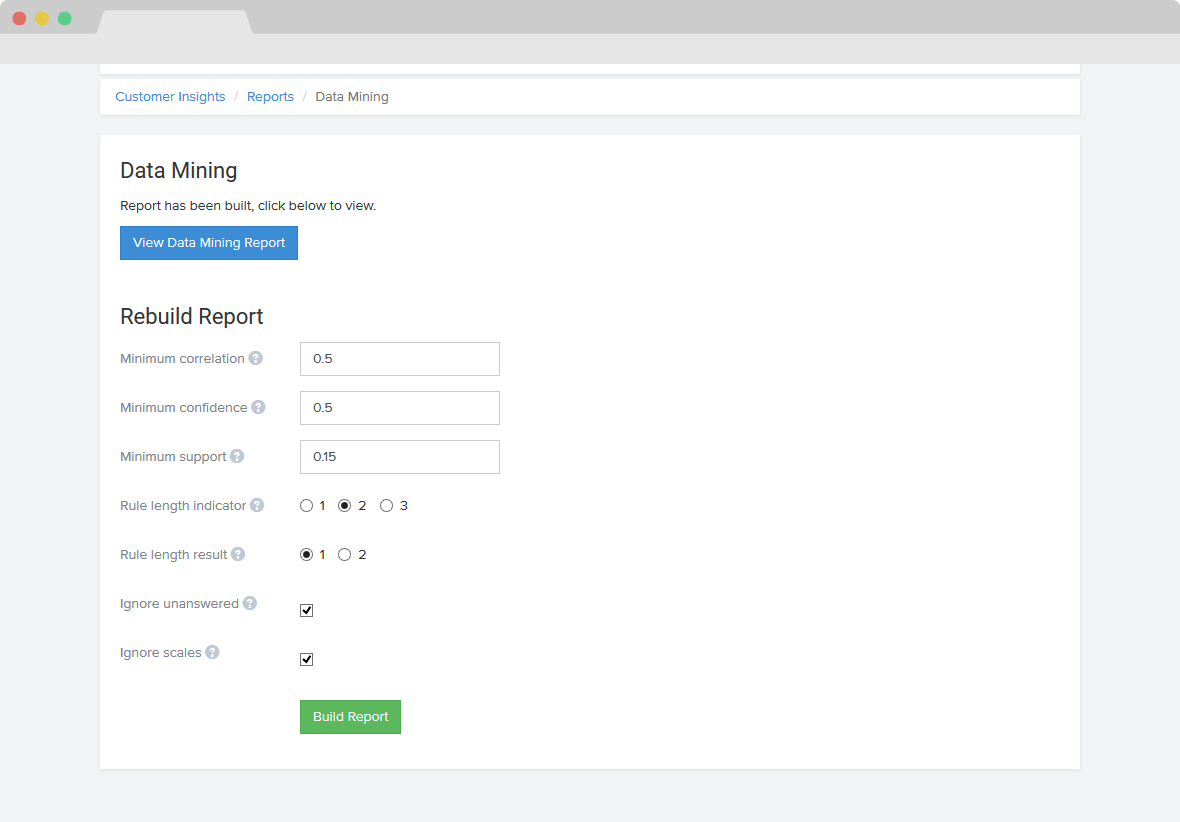
Is there a purer joy on earth than clicking a button and having a machine do lots of things and make you look even smarter? Umm, no.
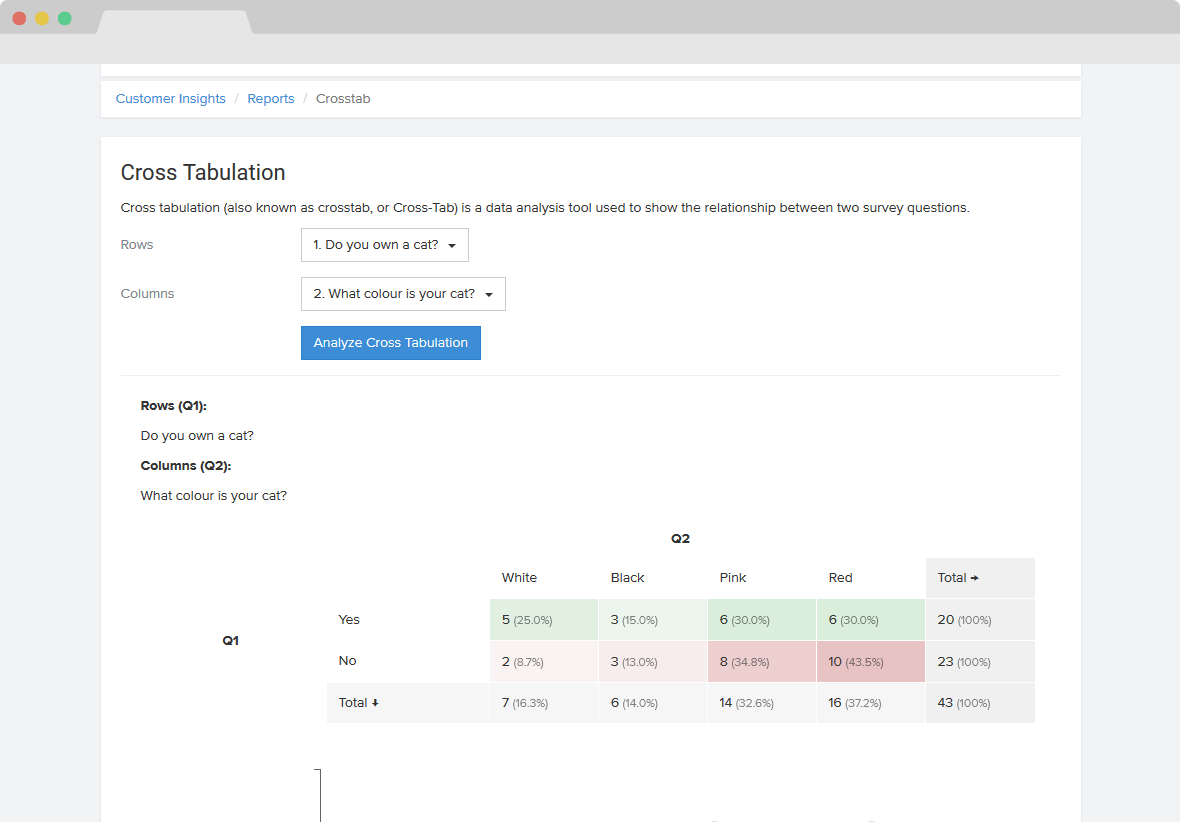
The Magic of Cross Tabulation
Is there a relationship between groups of respondents? If so, what is it?
To find the answer to questions like those, - the answers you really want - you'd normally need to pay for an SPSS license, upload your data to that complicated software, and hire an analyst to create contingency tables for you. Not ideal.
Instead, use FourEyes cross tabulation. Let us generate the insights you need. In just a click.
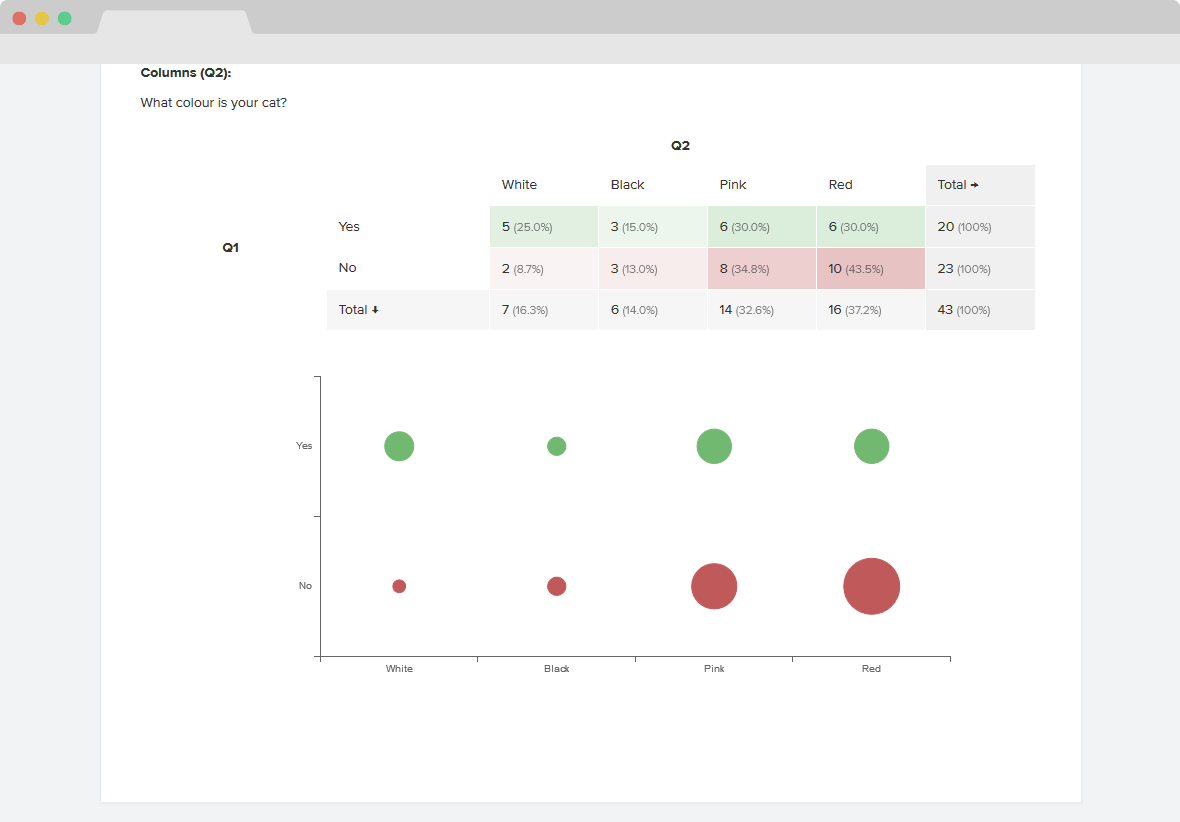
Find relationships between questions.


Instantly find insights! Your data is displayed in distinct colours to reflect the results of our Chi Squared analysis. So even non-geeks can quickly discern what's most important.
Give FourEyes a shot. It's free.
Predictive Data Mining
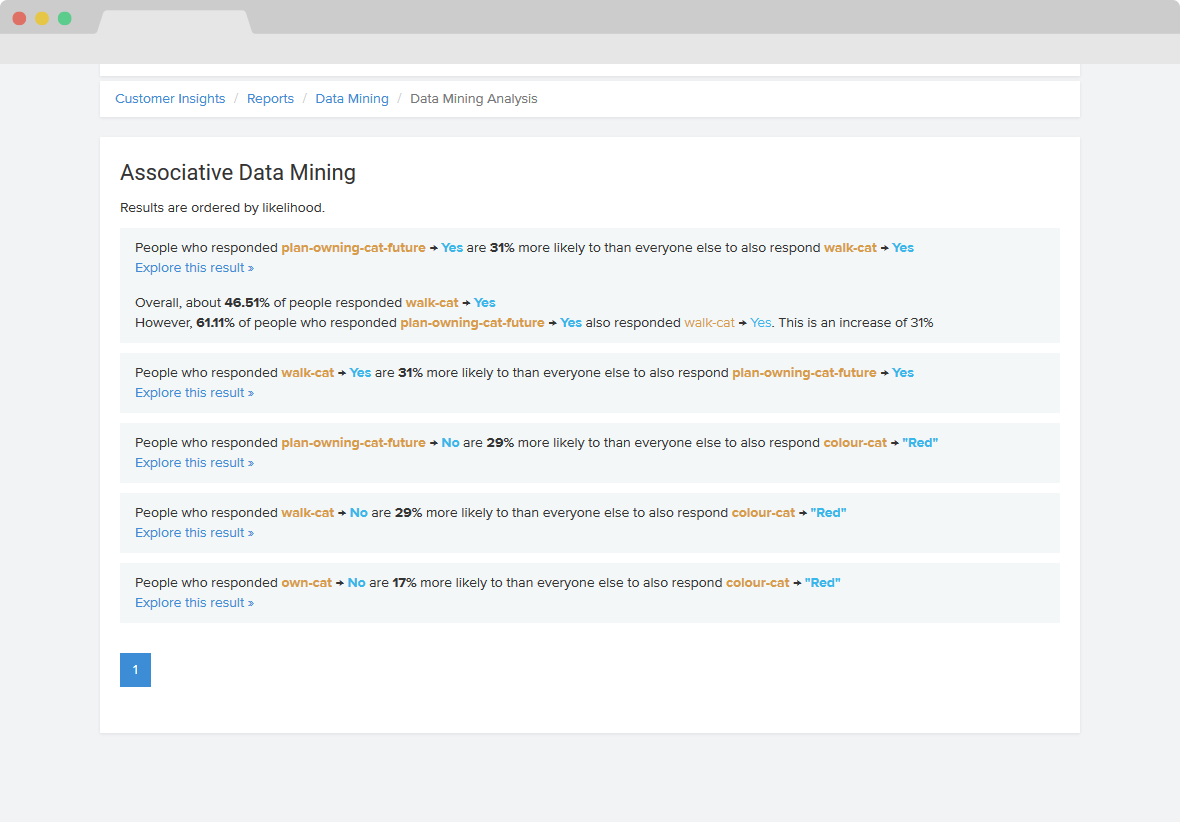
You'll dig a lot about FourEyes - but you'll luuuv our data mining. Why? Because it finds patterns and relationships between your entire survey's many variables, serving you up hidden insights and answering questions before you even think to ask them.
Let us explain.
Imagine you've surveyed continuing education students at a university about how satisfied they are with their program.
You might crosstab two points and find things like, "students over the age of 50 are 65% more likely to be satisfied with their program." Good insight. But data mining lets you go much, much bigger...
Because data mining finds relationships across all of your survey results. Like, "Students over the age of 50 are 85% more satisifed with the Business program offered, but only 30% more satisfied with the Science program, and 10% less satisfied with the English program." Stuff like this, and more.
Turn data into actionable stories.


The more responses FourEyes can work with, the more insights you'll get. So you can fill your slides with charts - but wow the room with the market insights at your fingertips.
Ready for you to Unlock
You can unlock cross-tabulation and data mining inside FourEyes.